Benchmarks
Measured TTFB and throughput data for specific route classes, configurations, and test conditions. These results are useful for technical evaluation, but they are not production guarantees and should be read with the cold-path and methodology caveats on this page.
Methodology Summary
This page draws from two benchmark datasets: a benchmark run from March 15, 2026 and an automated benchmark report from March 16, 2026. Both were single-origin environments without a CDN or a full-page cache, so every request reached PHP.
| Property | March 15 benchmark run | March 16 automated report |
|---|---|---|
| Date | March 15, 2026 | March 16, 2026 |
| Standard coverage | 8 URLs | 8 URLs |
| Warm repeats per URL | 30 | 30 |
| Cold passes per URL | 1 | Not specified in the benchmark materials |
| Configurations | Baseline, QuantumCache Free (Redis), QuantumCache Pro (Redis) | Baseline, QuantumCache Redis, QuantumCache MySQL fallback |
| WooCommerce coverage | Yes | No |
| Throughput sweep | ab, concurrency 4, 8, 16, 32 | ab, concurrency 32, 64, 128 |
| Environment | Single origin, no CDN, no page cache | Single origin, no CDN, no page cache |
| Notes | Includes WooCommerce cold-path data | Includes MySQL fallback data for standard pages only |
The March 16 report does not include WooCommerce routes and does not split Redis results into Free and Pro.
The two datasets are complementary, but they are not one continuous study and should not be merged into a single like-for-like comparison.
Standard Pages — Warm Steady-State (Redis)
8 standard URLs, 30 warm repeats per URLThese charts summarize warm-state reductions against the no-cache baseline on standard WordPress routes. Ranges reflect variation across the tested URLs, not statistical error bounds.
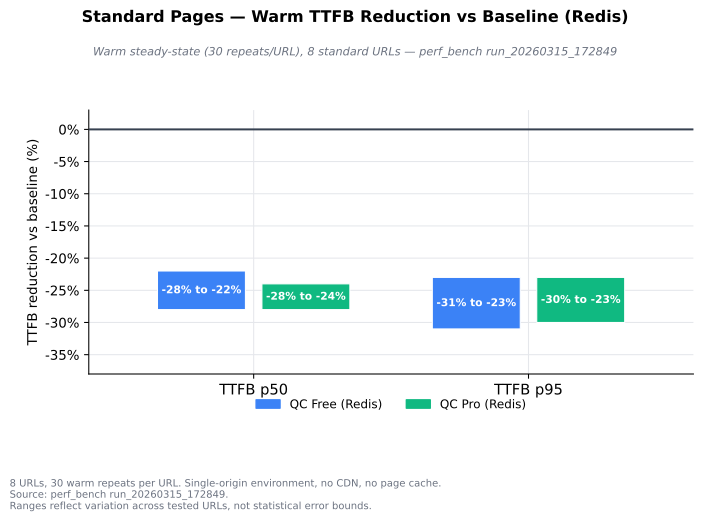
March 15 benchmark run. 8 standard URLs, 30 warm repeats per URL. Single-origin environment without CDN or page cache.
| Config | TTFB p50 reduction | TTFB p95 reduction | Total response p50 | Total response p95 |
|---|---|---|---|---|
| QuantumCache Free (Redis) | −22% to −28% | −23% to −31% | −16% to −24% | −16% to −26% |
| QuantumCache Pro (Redis) | −24% to −28% | −23% to −30% | −18% to −22% | −20% to −24% |
The March 16 automated report, which used a single Redis configuration rather than a Free/Pro split, reported TTFB p50 reductions of −24% to −27% and p95 reductions of −24% to −29%.
That corroborates the warm Redis result without adding a misleading third series to the chart.
Standard Pages — Warm Steady-State (MySQL Fallback)
Standard pages only, March 16 automated reportMySQL fallback data exists only for standard pages in the March 16 report. That report does not split the Redis results into Free and Pro tiers.
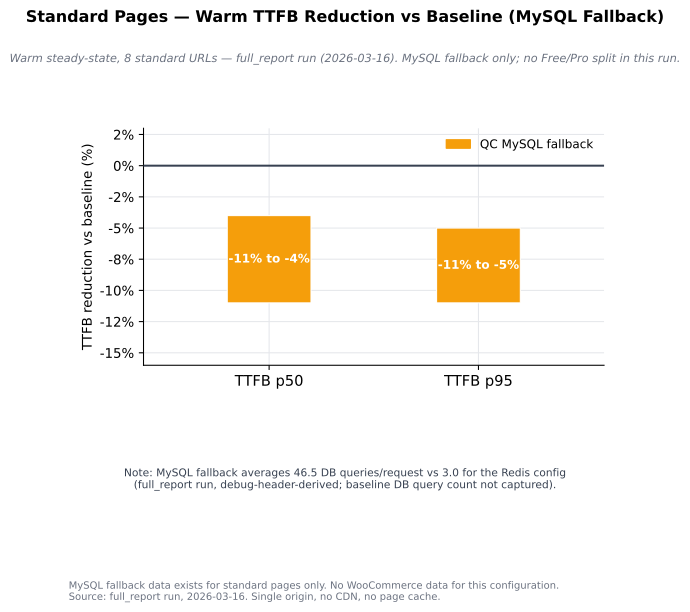
March 16 automated report. Standard pages only. Single-origin environment without CDN or page cache.
| Config | TTFB p50 reduction | TTFB p95 reduction | Total response p50 | Total response p95 |
|---|---|---|---|---|
| QuantumCache MySQL fallback | −4% to −11% | −5% to −11% | −1% to −8% | −1% to −7% |
The March 16 report recorded average DB-query counts of 46.5 per request for MySQL fallback and 3.0 for Redis. A no-cache baseline DB-query count was not captured in that report.
MySQL fallback is a measurable improvement over baseline on the tested standard routes, but it is not a peer to Redis in this benchmark set.
Standard Pages — Cold-Path Behavior
First request before warmup| Route | Baseline TTFB (ms) | Free delta | Pro delta |
|---|---|---|---|
/?cat=36&posts_per_page=24&paged=3 | 164.6 | −9.6% | −14.1% |
/?cat=36&posts_per_page=36&paged=2 | 171.1 | −27.6% | −32.5% |
/?cat=36&posts_per_page=36&paged=3 | 168.4 | −24.7% | −30.6% |
/ | 183.8 | −20.9% | −21.4% |
/?cat=heavycat&posts_per_page=36&paged=2 | 182.1 | −22.3% | −25.7% |
/?cat=uncategorized&posts_per_page=36&paged=3 | 174.1 | −19.3% | −22.1% |
/?cat=heavycat&posts_per_page=24&paged=2 | 183.6 | −24.4% | −27.4% |
WooCommerce Archive / Listing Pages — Warm Steady-State (Redis)
March 15 benchmark run onlyWooCommerce archive results should be read as two groups: heavy archive routes and lighter archive routes. Averaging them together would hide materially different behavior.
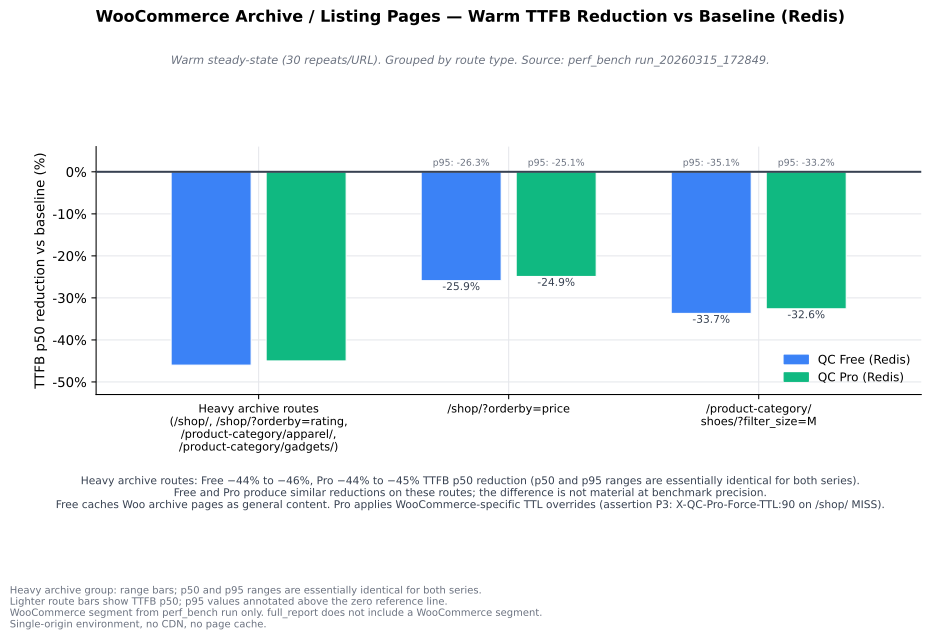
March 15 benchmark run. Heavy archive routes are shown separately from lighter archive routes. No MySQL fallback WooCommerce data is available.
| Route group | Config | TTFB p50 | TTFB p95 |
|---|---|---|---|
| Heavy archive routes | QuantumCache Free (Redis) | −44% to −46% | −44% to −46% |
| Heavy archive routes | QuantumCache Pro (Redis) | −44% to −45% | −44% to −45% |
/shop/?orderby=price | QuantumCache Free (Redis) | −25.9% | −26.3% |
/shop/?orderby=price | QuantumCache Pro (Redis) | −24.9% | −25.1% |
/product-category/shoes/?filter_size=M | QuantumCache Free (Redis) | −33.7% | −35.1% |
/product-category/shoes/?filter_size=M | QuantumCache Pro (Redis) | −32.6% | −33.2% |
On the heavy archive routes, Free and Pro are effectively similar at the precision of this benchmark.
Free caches these archive routes as general content. Pro applies WooCommerce-aware
behavior on top of the same core engine, including a WooCommerce-specific TTL override
on /shop/ miss responses.
WooCommerce Product Pages — Warm Steady-State (Redis)
March 15 benchmark run onlyImportant caveat: In this benchmark run, Free shows larger warm TTFB deltas than Pro on product pages. This does not indicate Free is generally faster. Pro introduces WooCommerce-specific behavior such as TTL overrides, endpoint bypass, product invalidation, and logged-in handling that is not captured by TTFB delta alone.
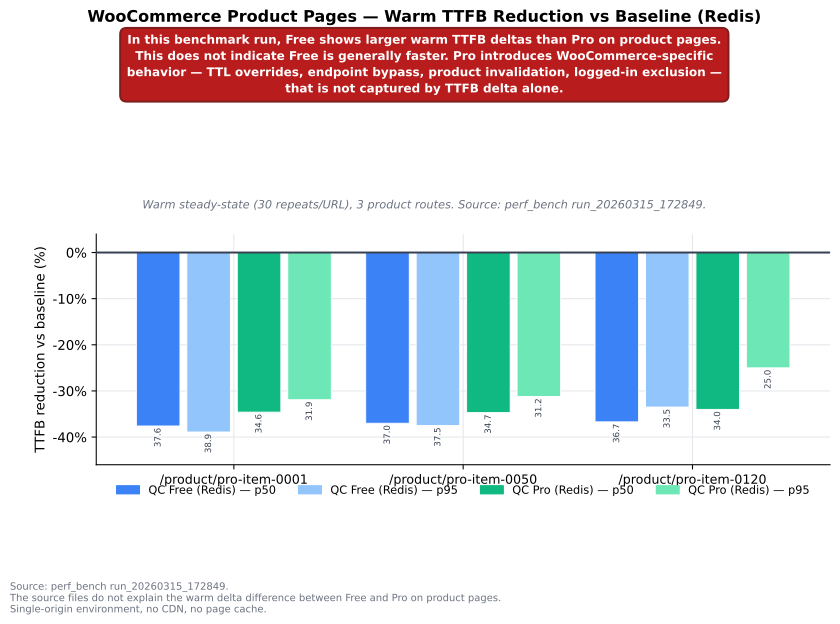
March 15 benchmark run. 3 product routes, 30 warm repeats per URL. The benchmark materials do not explain the measured Free and Pro delta difference on these routes.
| Route | Config | TTFB p50 | TTFB p95 |
|---|---|---|---|
/product/pro-item-0001 | QuantumCache Free (Redis) | −37.6% | −38.9% |
/product/pro-item-0001 | QuantumCache Pro (Redis) | −34.6% | −31.9% |
/product/pro-item-0050 | QuantumCache Free (Redis) | −37.0% | −37.5% |
/product/pro-item-0050 | QuantumCache Pro (Redis) | −34.7% | −31.2% |
/product/pro-item-0120 | QuantumCache Free (Redis) | −36.7% | −33.5% |
/product/pro-item-0120 | QuantumCache Pro (Redis) | −34.0% | −25.0% |
The measured difference is reproduced exactly as recorded. The benchmark materials do not explain why the product-page deltas are larger for Free than Pro in this run.
WooCommerce Pages — Cold-Path Behavior
First request before warmupCold-path behavior is mixed here too. Heavy archive routes show first-request overhead, while some filtered category and product routes show reductions. The warm-state WooCommerce charts above should not be read as first-request behavior.
| Route | Baseline TTFB (ms) | Free delta | Pro delta |
|---|---|---|---|
/shop/ | 578.8 | +17.0% | +16.0% |
/shop/?orderby=price | 186.3 | +28.2% | +30.3% |
/shop/?orderby=rating | 631.5 | +5.6% | +6.6% |
/product-category/gadgets/ | 589.3 | −8.6% | −8.3% |
/product-category/apparel/?min_price=50&max_price=150 | 641.3 | −8.3% | −7.3% |
/product-category/shoes/?filter_size=M | 142.1 | −31.5% | −27.3% |
/product/pro-item-0001/ | 319.4 | −38.9% | −19.2% |
/product/pro-item-0050/ | 393.3 | −25.5% | −6.3% |
/product/pro-item-0120/ | 400.9 | −23.2% | −5.9% |
Cold overhead is present on the heavy archive routes shown above.
The benchmark materials do not explain why the product-page cold-path reductions are larger for Free than Pro. The data is presented as measured, without smoothing or extrapolation.
Throughput — Standard Pages
Two separate studiesThe standard-page throughput charts below come from different benchmark datasets. They are presented together for completeness, but they should not be read as one continuous study.
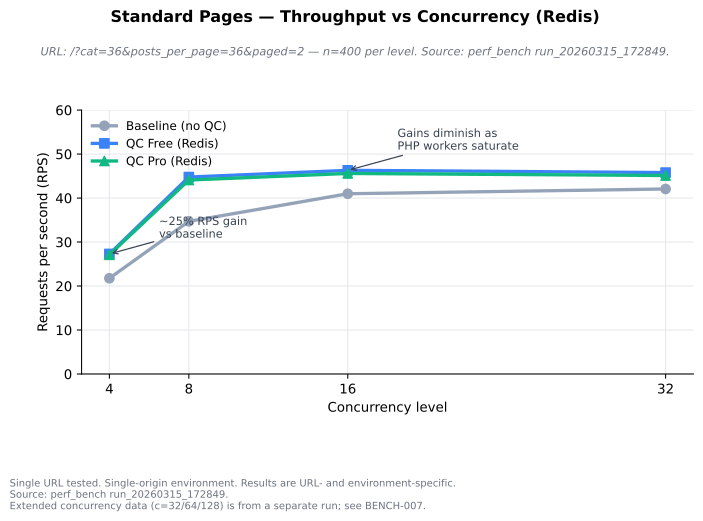
March 15 benchmark run. Tested URL: /?cat=36&posts_per_page=36&paged=2. n=400 per concurrency level.
| Concurrency | Baseline RPS | Free RPS | Pro RPS |
|---|---|---|---|
| 4 | 21.76 | 27.29 | 27.10 |
| 8 | 34.70 | 44.77 | 44.10 |
| 16 | 40.98 | 46.30 | 45.59 |
| 32 | 42.06 | 45.79 | 45.12 |
Free and Pro are effectively equivalent on this standard-page throughput sweep.
The largest gains appear at lower concurrency and narrow as PHP workers saturate.
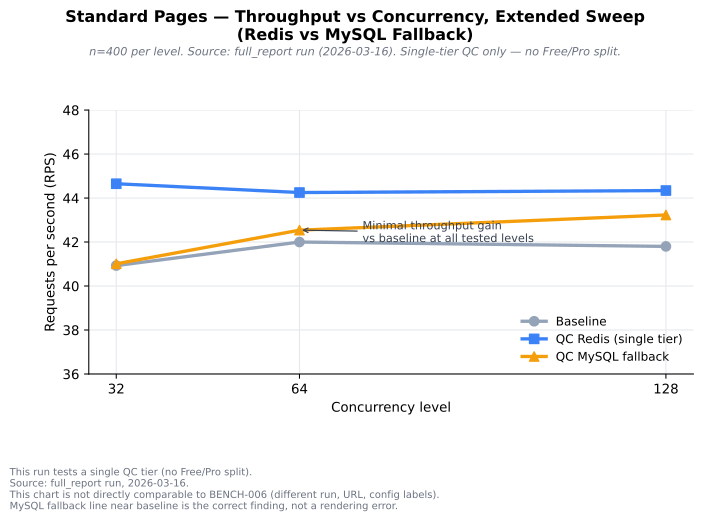
March 16 automated report. Redis and MySQL fallback only, with no Free/Pro split. n=400 per concurrency level.
| Concurrency | Baseline RPS | QuantumCache Redis RPS | QuantumCache MySQL fallback RPS |
|---|---|---|---|
| 32 | 40.93 | 44.65 | 41.01 |
| 64 | 42.00 | 44.25 | 42.54 |
| 128 | 41.80 | 44.34 | 43.23 |
MySQL fallback shows minimal throughput improvement over baseline at the tested concurrency levels.
Throughput — WooCommerce Pages
March 15 benchmark run only| /shop/ — throughput vs concurrency | |||
|---|---|---|---|
| Concurrency | Baseline RPS | Free RPS | Pro RPS |
| 4 | 6.06 | 10.17 | 10.11 |
| 8 | 9.72 | 15.72 | 15.61 |
| 16 | 12.03 | 17.22 | 17.18 |
| 32 | 13.34 | 17.59 | 17.48 |
On /shop/, Free and Pro track very closely across the tested concurrency
levels.
| /product/pro-item-0001/ — throughput vs concurrency | |||
|---|---|---|---|
| Concurrency | Baseline RPS | Free RPS | Pro RPS |
| 4 | 11.94 | 17.71 | 16.91 |
| 8 | 19.32 | 27.43 | 26.20 |
| 16 | 23.09 | 29.73 | 28.39 |
| 32 | 25.48 | 30.18 | 28.69 |
Technical Appendix — Cache Counters
Post-warm pass| Segment | Config | query_hits | frag_hits | query_misses | frag_misses | query_stores | frag_stores |
|---|---|---|---|---|---|---|---|
| Standard | Free | 136 | 1,651 | 142 | 0 | 4 | 10 |
| Standard | Pro | 270 | 3,284 | 282 | 0 | 6 | 15 |
| WooCommerce | Free | 534 | 4,916 | 326 | 0 | 14 | 21 |
| WooCommerce | Pro | 798 | 8,035 | 370 | 0 | 22 | 70 |
These counters are useful as an implementation appendix, not as a direct performance ranking.
They reflect post-warm behavior only and should not be read as cold-path evidence.
Methodology Limits
No CDN or page cache was present in either benchmark environment. All measured requests reached PHP.
MySQL fallback data exists for standard pages only. No WooCommerce MySQL fallback benchmark data is available.
Results are specific to the tested routes and configurations. Different sites, stacks, and workloads may behave differently.
Cold-path variance is real in the measured data. The benchmark materials do not explain why some routes show first-request overhead and others do not.
The product-page Free vs Pro delta difference is measured but unexplained. That applies to both warm and cold product-page data on this page.
The DB-query comparison for Redis and MySQL fallback comes from one standard-page report. That report did not capture a no-cache baseline DB-query count.
Need the architecture behind these results?
Use the technical overview for request flow and the tier comparison for product boundaries.